Company Update | Consumer Durable
March 25, 2019
Amber Enterprises India Ltd
BUY
CMP
`776
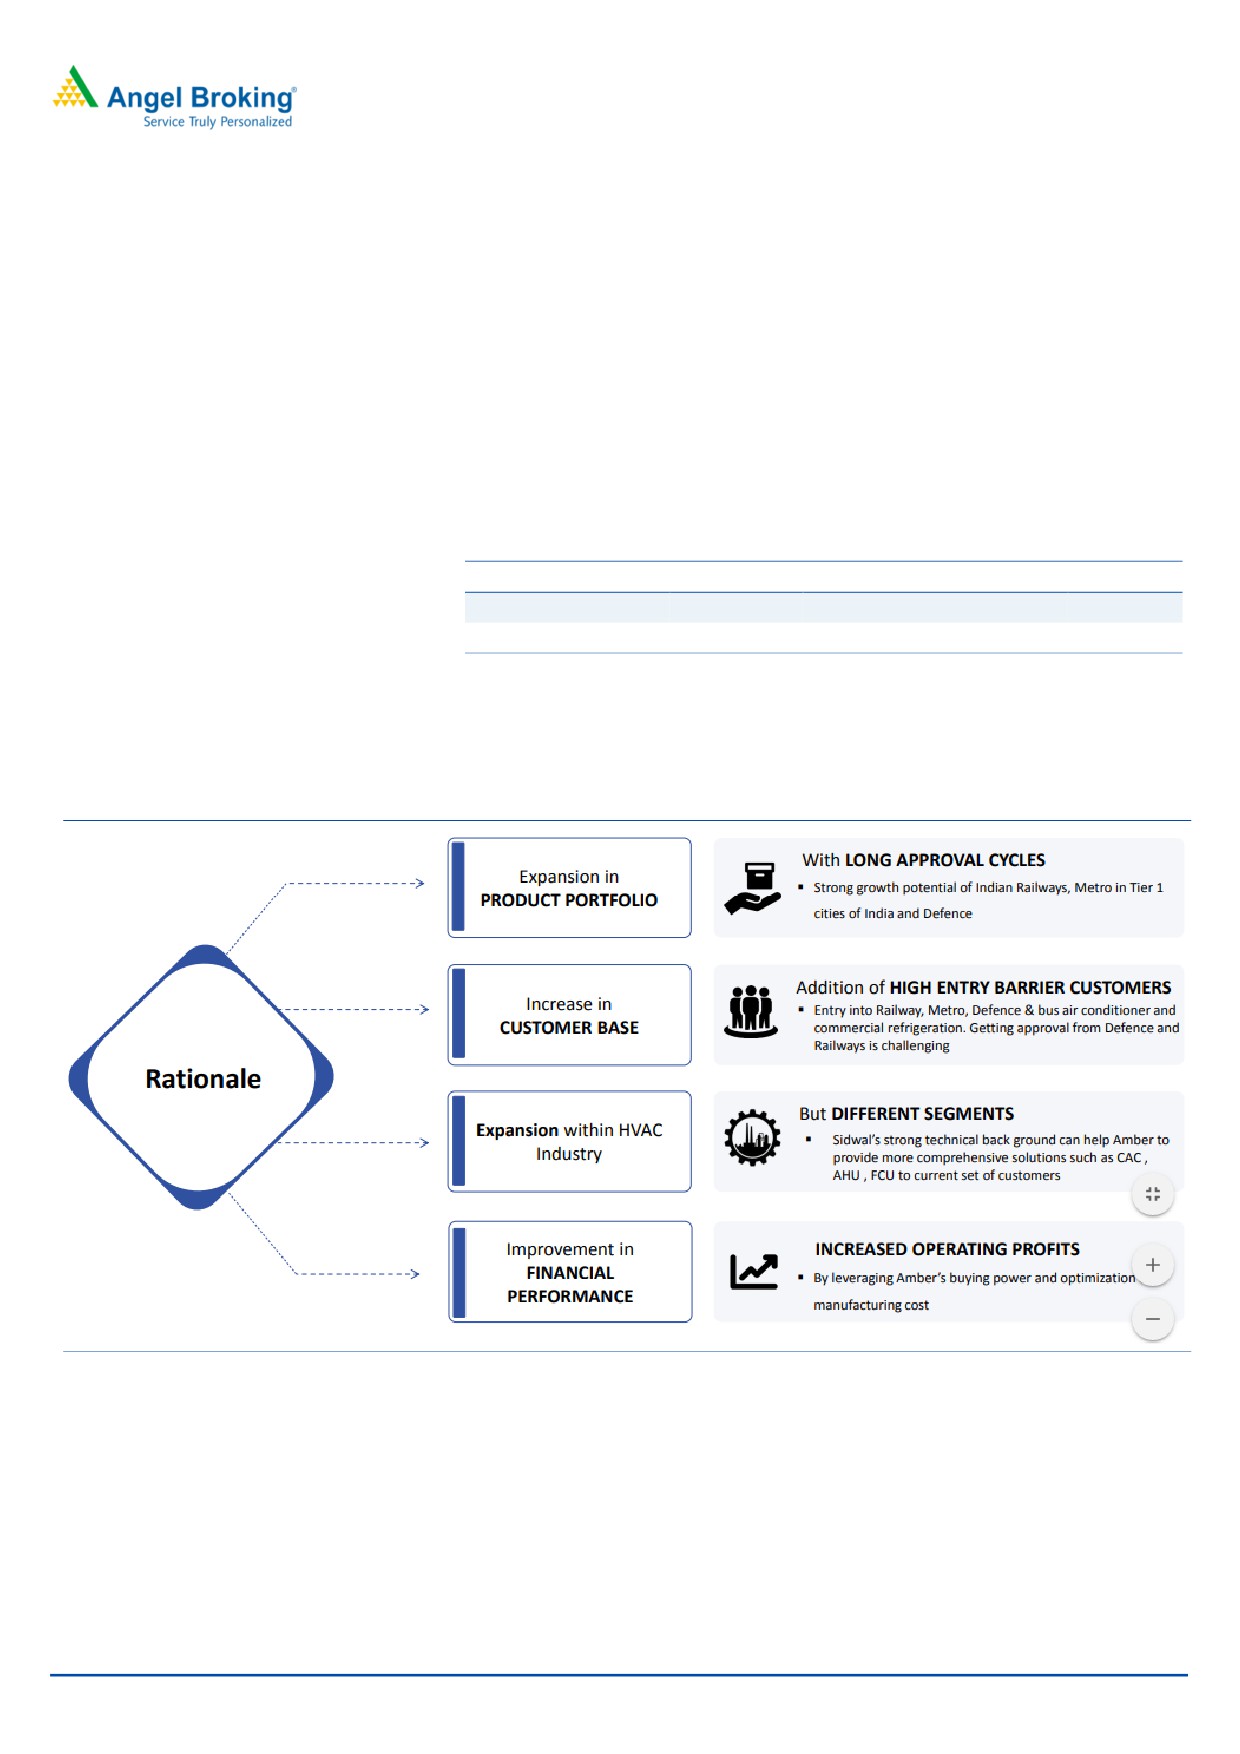
Sidwal’s acquisition to expand product portfolio
Target Price
`910
Event: Amber Enterprises’ (Amber) has approved to enter into the definitive
Investment Period
12 Months
agreements for acquiring 80% stake upfront in the equity share capital of Sidwal
Refrigeration Industries Private Ltd ("Sidwal"), which will include the business of
Sidwal Technologies. The deal valuation are not disclosed but the management
Stock Info
has indicated that the deal value could be worth `180-200 crore for 80% stake
Sector
Consumer Durable
(at 5.5-6x EV/ EBITDA and 10x FY2019E earnings).
Market Cap (` cr)
2,440
Beta
1.0
Sidwal’s background - Sidwal is the leading player in the Mobile (Transportation)
52 Week High / Low
1200/621
Air Conditioning and Refrigeration Industry. It has diversified portfolio of HVAC
Avg. Daily Volume
12,392
solutions to Indian Railways (forms 72% of Sidwal’s revenue), Metro Segments,
Face Value (`)
2
Defence (9%), Telecom (4%), Bus (9%). It also provide strong post sale support to
BSE Sensex
37,808
its customers - primarily for the Railway, Metro and Bus segment.
Nifty
11,354
Our take on the deal- The acquisition would expand Amber’s portfolio in the
Reuters Code
AMBE.BO
HVAC space in mobile applications. The deal is likely to be funded via a mix of
Bloomberg Code
AMBER.IN
internal accruals and debt where the group debt level would not exceed the
internal threshold limit of 1.5-1.75x EBITDA. They also assured that the deal
Shareholding Pattern (%)
would be EPS/ ROCE accretive as Sidwal has high growth prospects/OPM of 20%
Promoters
44.0
with nil LT debt and low working capital requirements.
MF / Banks / Indian Fls
33.0
Outlook: We remain bullish on the niche space that Amber is in and its expansion
FII / NRIs / OCBs
10.8
plan in the related HVAC space. Q4FY2019 results will be keenly monitored for
Indian Public / Others
12.2
signs of growth as the last “cooler” summer season has spoiled its M9FY2019
results. We expect a CAGR of ~21%/38% in consolidated revenue/ earnings over
Abs.(%)
3m 1yr 3yr
FY2018-20E without taking this acquisition into account (would wait for deal’s
Sensex
7.6
15.6
50.7
fine prints). We maintain BUY with a target price of `910(25x FY2020E EPS).
Amber
(16.3)
(28.9)
Key Consolidated Financials
Y/E March (` cr)
FY2016
FY2017
FY2018
FY2019E
FY2020E
Net Sales
1,089.0
1,651.9
2,128.1
2,778.0
3,125.2
% chg
-11.5
51.7
28.8
30.5
12.5
Net Profit
24.1
25.2
62.3
90.0
114.4
Nidhi Agrawal
% chg
-13.5
4.5
147.4
44.4
27.2
+022 39357600 Ext-6872
EBITDA (%)
10.4
7.9
8.6
7.0
7.5
EPS (Rs)
7.7
8.0
19.8
28.6
36.4
P/E (x)
101.2
96.9
39.2
27.1
21.3
P/BV (x)
9.3
7.3
2.7
2.5
2.3
RoE (%)
9.2
7.5
7.0
9.3
10.7
RoCE (%)
14.1
13.3
13.5
13.5
15.4
EV/EBITDA
23.9
20.8
12.8
11.5
9.5
EV/Sales
2.5
1.6
1.1
0.8
0.7
Source: Company, Angel Research
Please refer to important disclosures at the end of this report
1
Amber Enterprises |Event Update
Sidwal’s details
Sidwal was founded by NRI technocrat Mr. S.S. Sidhu a Mechanical Engineer from
the University of Michigan in 1975. Headquartered in NCR, Sidwal operates 3 fully
integrated facilities in Northern India with the capability to undertake the entire
HVAC manufacturing process in-house. It is the market leader in the Railway and
Metro segments with a track record of supplying 15,000+ HVAC units for mainline
coaches and 2,000+ HVAC units for metro coaches. It also has a dominating
market share in the defence Segment. It has an order book of ` 200 cr with AMC
contracts. FY2019 is expected to be good with 15%+ yearly growth in revenue
and a OPM of 20%+ and a PAT of over ` 23 crore.
Exhibit 1: Turnover of Sidwal
FY16
FY17
FY18
FY19E
Turnover*
116
124
165
195
YoY growth
7.0%
33.1%
18.0%
Source: Company, Angel Research
* Turnover of Sidwal Refrigeration Industries Pvt Ltd & Sidwal Technologies without eliminating
intercompany transactions
Exhibit 2: How acquisition will help Amber?
Source: Company, Angel Research
March 25, 2019
2
Amber Enterprises |Event Update
Risks to our estimates
Client concentration
Amber’s business is dependent on certain principal customers and the loss of or a
significant reduction in purchases by such customers could adversely affect its
business, financial condition, results of operations and future prospects
Downward trend in OEM/ODM business
In recent years, RAC brands have increasingly outsourced the manufacturing of
their products to OEM/ODM players like Amber. However, there can be no
assurance that they will continue to do so in the future.
Changing preferences, weather advancement in technology
The markets in which company’s customers compete are characterized by
consumers, weather patterns and their rapidly changing preferences, advancement
in technology and other related factors including lower manufacturing costs.
Hence, the company may be affected by any disruptions in the industry.
March 25, 2019
3
Amber Enterprises |Event Update
Consolidated Profit & Loss Statement
Y/E March (` cr)
FY2016
FY2017
FY2018
FY2019E
FY2020E
Total operating income
1,089.0
1,651.9
2,128.1
2,778.0
3,125.2
% chg
-11.5
51.7
28.8
30.5
12.5
Total Expenditure
975.3
1,521.3
1,944.5
2,582.3
2,892.0
Raw Material
858.5
1,371.2
1,768.8
2,352.9
2,647.1
Personnel
36.5
43.7
49.8
65.0
73.1
Others Expenses
80.3
106.5
125.9
164.4
171.9
EBITDA
113.7
130.5
183.5
195.7
233.2
% chg
10.9
14.8
40.6
6.6
19.2
(% of Net Sales)
10.4
7.9
8.6
7.0
7.5
Depreciation& Amortisation
30.9
40.1
49.0
51.2
54.3
EBIT
82.9
90.4
134.5
144.4
178.9
% chg
7.6
9.1
48.8
7.4
23.9
(% of Net Sales)
7.6
5.5
6.3
5.2
5.7
Interest & other Charges
53.2
63.5
53.8
18.8
15.0
Other Income
3.1
8.8
8.7
7.4
6.3
(% of Sales)
0.3
0.5
0.4
0.3
0.2
Extraordinary Items
-
-
-
-
-
Share in profit of Associates
-
-
-
-
-
Recurring PBT
32.7
35.7
89.4
133.0
170.2
% chg
-19.0
9.2
150.4
48.8
28.0
Tax
8.6
10.5
27.1
41.2
52.8
PAT (reported)
24.1
25.2
62.3
90.0
114.4
% chg
-13.5
4.5
147.4
44.4
27.2
(% of Net Sales)
2.2
1.5
2.9
3.2
3.7
Basic & Fully Diluted EPS (Rs)
7.7
8.0
19.8
28.6
36.4
% chg
-13.5
4.5
147.4
44.4
27.2
March 25, 2019
4
Amber Enterprises |Event Update
Consolidated Balance Sheet
Y/E March (` cr)
FY2016
FY2017
FY2018
FY2019E FY2020E
SOURCES OF FUNDS
Equity Share Capital
21.7
23.8
31.4
31.4
31.4
Reserves& Surplus
240.9
311.1
861.3
937.2
1,033.7
Shareholders Funds
262.6
334.9
892.8
968.7
1,065.2
Minority Interest
-
-
-
-
-
Total Loans
326.6
344.9
105.5
100.0
100.0
Other Liab & Prov
80.8
46.8
64.4
84.1
94.6
Total Liabilities
670.0
726.6
1,062.7
1,152.8
1,259.8
APPLICATION OF FUNDS
Net Block
536.1
577.5
739.8
789.8
839.8
Capital Work-in-Progress
2.0
3.0
4.0
5.0
6.0
Investments
-
-
5.7
55.7
105.7
Current Assets
533.6
650.4
964.0
1,156.5
1,271.1
Inventories
225.8
267.7
395.6
456.7
513.7
Sundry Debtors
247.9
310.4
378.6
456.7
513.7
Cash
18.4
34.7
133.8
154.5
141.3
Loans & Advances
40.6
37.1
28.3
55.6
62.5
Other Assets
1.0
0.5
27.6
33.1
39.8
Current liabilities
445.0
560.0
665.8
869.2
977.8
Net Current Assets
88.6
90.4
298.2
287.3
293.3
Other Non Current Asset
45.3
58.6
19.1
20.0
21.0
Total Assets
670.0
726.6
1062.7
1152.8
1259.8
March 25, 2019
5
Amber Enterprises |Event Update
Consolidated Cash Flow Statement
Y/E March (`cr)
FY2016
FY2017
FY2018
FY2019E FY2020E
Profit before tax
32.7
38.4
89.4
133.0
170.2
Depreciation
30.9
39.7
49.0
51.2
54.3
Change in Working Capital
42.9
(23.3)
(67.7)
(28.4)
(74.9)
Interest / Dividend (Net)
-
-
-
-
-
Direct taxes paid
(10.5)
(9.0)
(27.1)
(41.2)
(52.8)
Others
(56.2)
(52.7)
(38.8)
4.3
27.0
Cash Flow from Operations
152.2
98.5
82.4
110.4
69.8
(Inc.)/ Dec. in Fixed Assets
(101.2)
(82.0)
(162.2)
(50.0)
(50.0)
(Inc.)/ Dec. in Investments
1.4
0.8
-
-
-
Cash Flow from Investing
(83.9)
(89.7)
(162.2)
(50.0)
(50.0)
Issue of Equity
-
50.0
505.3
-
-
Inc./(Dec.) in loans
150.6
46.4
(239.4)
(5.5)
-
Others
218.5
97.6
63.6
32.9
32.9
Cash Flow from Financing
(67.9)
(1.2)
202.3
(38.4)
(32.9)
Inc./(Dec.) in Cash
0.4
7.6
122.5
22.0
(13.1)
Opening Cash balances
2.0
2.4
10.0
132.5
154.5
Closing Cash balances
2.4
10.0
132.5
154.5
141.3
March 25, 2019
6
Amber Enterprises |Event Update
Key Ratios - Consolidated
Y/E March
FY16
FY17
FY18
FY19E
FY20E
Valuation Ratio (x)
P/E (on FDEPS)
101.2
96.9
39.2
27.1
21.3
P/CEPS
22.9
20.5
10.0
7.3
5.9
P/BV
9.3
7.3
2.7
2.5
2.3
Dividend yield (%)
-
-
-
-
EV/Sales
2.5
1.6
1.1
0.8
0.7
EV/EBITDA
23.9
20.8
12.8
11.6
9.6
EV / Total Assets
4.1
3.7
2.2
2.0
1.8
Per Share Data (`)
EPS (Basic)
7.7
8.0
19.8
28.6
36.4
EPS (fully diluted)
7.7
8.0
19.8
28.6
36.4
Cash EPS
33.9
37.9
77.9
106.3
131.7
Book Value
83.5
106.5
283.9
308.0
338.7
Returns (%)
ROCE
14.1
13.3
13.5
13.5
15.4
Angel ROIC (Pre-tax)
13.7
13.9
15.9
16.6
19.1
ROE
9.2
7.5
7.0
9.3
10.7
Turnover ratios (x)
Asset Turnover (Gross Block)
2.3
2.9
3.8
4.5
4.7
Inventory / Sales (days)
76
59
68
60
60
Receivables (days)
83
69
65
60
60
Payables (days)
95
99
98
98
98
Working capital cycle (ex-cash) (days)
64
29
35
22
22
Source: Company, Angel Research
March 25, 2019
7
Amber Enterprises |Event Update
Research Team Tel: 022 - 39357800
DISCLAIMER:
Angel Broking Limited (hereinafter referred to as “Angel”) is a registered Member of National Stock Exchange of India Limited, Bombay
Stock Exchange Limited, Metropolitan Stock Exchange Limited, Multi Commodity Exchange of India Ltd and National Commodity &
Derivatives Exchange Ltd It is also registered as a Depository Participant with CDSL and Portfolio Manager and Investment Adviser with
SEBI. It also has registration with AMFI as a Mutual Fund Distributor. Angel Broking Limited is a registered entity with SEBI for Research
Analyst in terms of SEBI (Research Analyst) Regulations, 2014 vide registration number INH000000164. Angel or its associates has not
been debarred/ suspended by SEBI or any other regulatory authority for accessing /dealing in securities Market. Angel or its
associates/analyst has not received any compensation / managed or co-managed public offering of securities of the company covered
by Analyst during the past twelve months.
This document is solely for the personal information of the recipient, and must not be singularly used as the basis of any investment
decision. Nothing in this document should be construed as investment or financial advice. Each recipient of this document should make
such investigations as they deem necessary to arrive at an independent evaluation of an investment in the securities of the companies
referred to in this document (including the merits and risks involved), and should consult their own advisors to determine the merits and
risks of such an investment.
Reports based on technical and derivative analysis center on studying charts of a stock's price movement, outstanding positions and
trading volume, as opposed to focusing on a company's fundamentals and, as such, may not match with a report on a company's
fundamentals. Investors are advised to refer the Fundamental and Technical Research Reports available on our website to evaluate the
contrary view, if any
The information in this document has been printed on the basis of publicly available information, internal data and other reliable
sources believed to be true, but we do not represent that it is accurate or complete and it should not be relied on as such, as this
document is for general guidance only. Angel Broking Limited or any of its affiliates/ group companies shall not be in any way
responsible for any loss or damage that may arise to any person from any inadvertent error in the information contained in this report.
Angel Broking Limited has not independently verified all the information contained within this document. Accordingly, we cannot testify,
nor make any representation or warranty, express or implied, to the accuracy, contents or data contained within this document. While
Angel Broking Limited endeavors to update on a reasonable basis the information discussed in this material, there may be regulatory,
compliance, or other reasons that prevent us from doing so.
This document is being supplied to you solely for your information, and its contents, information or data may not be reproduced,
redistributed or passed on, directly or indirectly.
Neither Angel Broking Limited, nor its directors, employees or affiliates shall be liable for any loss or damage that may arise from or in
connection with the use of this information.
Disclosure of Interest Statement
Amber Enterprises
1. Financial interest of research analyst or Angel or his Associate or his relative
No
2. Ownership of 1% or more of the stock by research analyst or Angel or associates or
No
relatives
3. Served as an officer, director or employee of the company covered under Research
No
4. Broking relationship with company covered under Research
No
Ratings (Based on Expected Returns:
Buy (> 15%)
Accumulate (5% to 15%)
Neutral (-5 to 5%)
over 12 months investment period)
Reduce (-5% to -15%)
Sell (< -15%)
March 25, 2019
8